





Android TV vs Apple TV Market Share: Roku, Fire TV Lead
Google's TV platform holds a six-point lead over Apple's tvOS in the latest Hub Entertainment Research survey, 14% to 8%, among U.S. respondents describing the operating system on their most-used TV or streaming player, according to Android Authority. That lead matters less than the gap separating both companies from Roku and Fire TV. Before going further, it's worth being precise about what's actually being measured here: this is a survey of primary viewing setups, not shipment figures, installed base, or every screen in a household.
Roku alone claims 37% of those same most-used setups. Add Amazon Fire TV's 17%, and the combined Roku-Fire TV figure reaches 54%, nearly four times Android TV's share, according to 9to5Google. Google's win over Apple is real. It's just not the story the headline number suggests.
There's a labeling wrinkle worth clearing up early, too. Some outlets report Google's figure simply as Android TV, while 9to5Google describes it as a combined Google TV and Android TV category, reflecting how Google's branding for the platform has shifted. This article uses Android TV as the consistent term going forward, matching the framing in Android Authority and The Streamable.
What follows covers four things: what the Android-Apple comparison actually shows and doesn't, why Roku and Fire TV sit so far ahead of everyone else, why the operating system itself is becoming the thing platforms compete on, and why a preference for easy search over recommendations might matter more than any single percentage above.
Android TV vs Apple TV market share: what the survey does and doesn't show
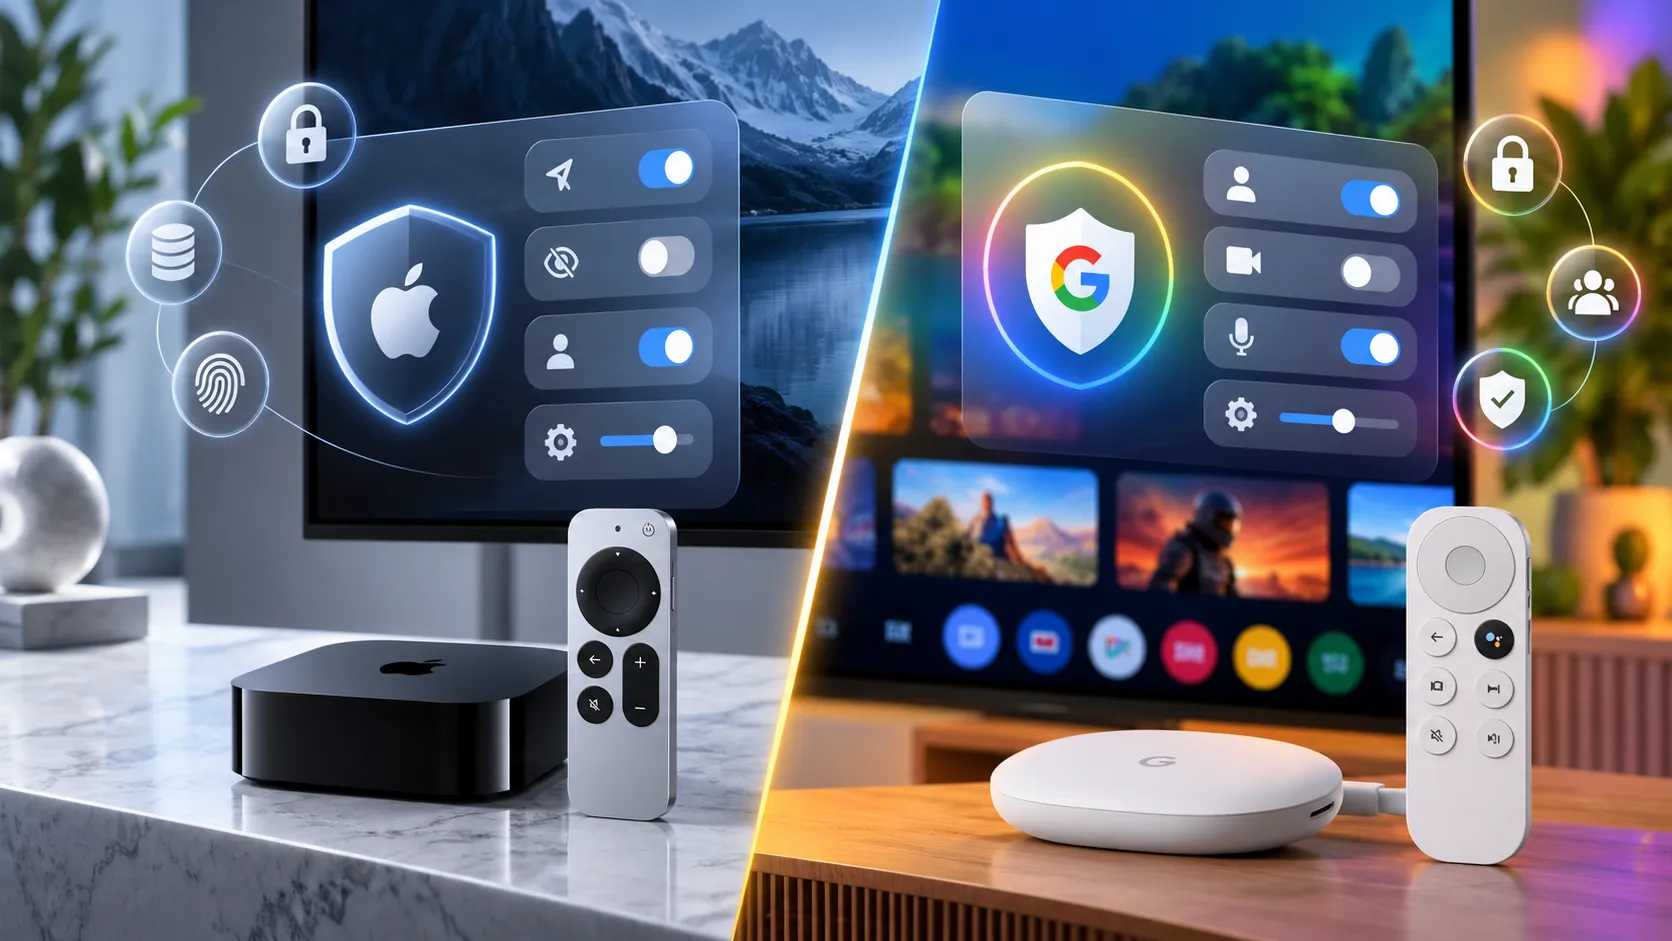
Hub's "Evolution of the TV Set" survey put Android TV at 14% and Apple's tvOS at 8%, a clear if modest lead for Google. That gives Apple TV's tvOS a smaller share in this particular measurement, and it lands Android TV in third place overall, according to Android Authority. Samsung's Tizen OS sits in the same spot as Apple, also at 8%, effectively tying tvOS for fourth in this smart TV operating system market share ranking, per The Streamable.
The figures come from 2,500 U.S. consumers ages 16 to 74, surveyed in May 2026, according to Advanced Television. That's a sizeable consumer survey, but it measures one thing specifically: the operating system on a respondent's single most-used TV or streaming player, not every device in the home and not a running trend line. It also shouldn't be read as directly comparable to household-usage data from other trackers, a point that matters once Parks Associates enters the picture below.
The arithmetic is worth stating plainly. A six-point margin over Apple looks meaningful until it sits next to the 23-point gap separating Android TV from Roku, drawn from the same Hub figures. One number tells a modest story; the other tells the real one, and it's where the next section picks up.
Roku vs. Fire TV vs. Android TV: why the market is so concentrated
Strip out the Android-Apple subplot and the category looks almost binary. Roku and Fire TV together appeared on 54% of most-used setups in Hub's survey, more than the rest of the field combined, per Android Authority and The Streamable. Roku's 37% alone is more than double Android TV's 14%.
That concentration plays out across more than a single screen. Hub's data shows most U.S. homes have three TVs, and two of those are now smart TVs, according to Advanced Television. The survey doesn't track how platform choices shift as households replace individual sets over time, but the multi-screen reality does mean this ranking describes an environment with several purchase decisions per household, not one.
Not every survey produces the same hierarchy, and that discrepancy is worth sitting with rather than glossing over. Parks Associates, tracking connected TV platform usage among U.S. broadband households in research published in April, put Roku at 28% and Samsung's Tizen at 23%, a picture where Tizen sits much closer to Roku than Hub's numbers suggest, according to Parks Associates.
Part of the gap likely comes down to what each firm is actually asking. Hub's question is a self-report about a single most-used device; Parks' tracker measures usage across broadband households more broadly, a different unit of analysis that would naturally produce different shares even if the underlying market hadn't moved at all. Neither approach is wrong, but treating the two as directly comparable is where a lot of loose "market share" reporting goes astray.
Michael Goodman, Parks Associates' director of entertainment, frames the stakes of this concentration simply: control of the platform layer sits at the center of competition in the connected TV market, according to Parks Associates. The same release notes that as AI-driven search and personalization take on a bigger role in these platforms, that competition over the platform layer is only likely to intensify.
Which smart TV operating system is most popular? Why the OS is becoming the discovery layer
The reason any of this matters beyond bragging rights is that primary TV viewing is increasingly app-centric, according to Hub's survey, powered overwhelmingly by Roku and Fire TV rather than the traditional channel guide, per Advanced Television. That shift puts the operating system in a position to shape what viewers discover and see promoted on the home screen.
That influence carries more weight because of how little viewers touch their setups afterward. Only 51% of viewers install any suggested apps during initial setup, and 56% say they rarely or never add new apps after that, up from 47% who said the same in 2024, according to Advanced Television. That makes the initial setup and default home screen unusually important, since many viewers appear to leave their app selection largely untouched once it's made.
There's a measurable payoff tied to which platform sits in front of the viewer. Titles suggested on Apple TV, Fire TV, Android, and Roku home screens are more likely to be watched than titles suggested on Samsung's Tizen or LG's webOS, per Advanced Television. The source frames this as a likelihood rather than a guarantee, and the supplied data doesn't extend to how studios or streamers negotiate placement around it, a question the current research simply doesn't answer.
Why easy streaming search matters more than recommendations
If the home screen functions as a gatekeeper, the next question is what viewers actually want that gatekeeper to do. It helps to separate three things platforms often blur together: search, which helps a viewer retrieve something they already have in mind; recommendations, which generate new options; and filtering, which narrows the field by removing what a viewer won't want. Hub's data suggests viewers rank these very differently.
Sixty percent of respondents called easy search the most important feature when hunting for something new, compared with just 31% who prioritized personalized recommendations, per Android Authority and The Streamable. Easy search topped the list of features rated "very important," ahead of a system remembering viewer preferences (46%) and surfacing trending content (25%), according to Advanced Television. These are separate importance ratings rather than a forced single choice, but the ranking is consistent across all three sources.
The AI question sharpens the same distinction. Asked what single AI feature would help most, 28% said filtering out content they probably wouldn't enjoy, narrowly ahead of the 27% who wanted more personalized suggestions generated for them, per The Streamable and Android Authority. Google TV already offers both types of feature, according to 9to5Google, though the supplied data doesn't establish that those tools outperform rivals' versions or explain Android TV's 14% share on their own.
The responses point to a different priority than the industry's usual assumption. Reducing irrelevant options may matter as much as generating new recommendations, which is a subtly different problem than the one most recommendation engines were built to solve. Filtering answers "what should I stop seeing," while recommending answers "what else might I like," and Hub's numbers suggest viewers currently care more about the former.
What this data does not prove
Two limits are worth stating directly before drawing conclusions from any of this. First, the survey does not show that Google's search and filtering tools caused its 14% share; the two facts sit next to each other in the same report, but nothing in the data traces a causal line between them. Second, none of the surveys measure which platform has the best search experience. They measure what viewers say they value, and where suggested titles are more likely to get watched, which is a proxy for discovery quality, not a direct test of it.
Jason Platt Zolov, Hub's senior consultant, frames where this competition is headed. "The conversation around finding great TV to watch is poised to become like the 'Mac vs PC' or 'Android vs iPhone' battles from prior years," he said, "as viewers learn that some TV operating systems do better jobs than others at helping them find good stuff to watch," according to Advanced Television. Zolov also pointed to a hypothetical Fox-Roku merger as a possible test case for that argument. The supplied reporting doesn't establish that such a transaction is underway, and it should be read as one consultant's speculation rather than confirmed industry news.
What the survey data does support is more modest and, in a way, more useful. Roku and Fire TV currently win on raw share, Android TV has a real if narrow edge over Apple, and none of that settles which platform actually helps someone find something worth watching. If Zolov's framing holds, the next phase of this competition won't be measured in points of device share. It will be measured by which platform helps a tired viewer find something worth watching without another long scroll.


Comments
Be the first, drop a comment!